
What is Data Visualization?
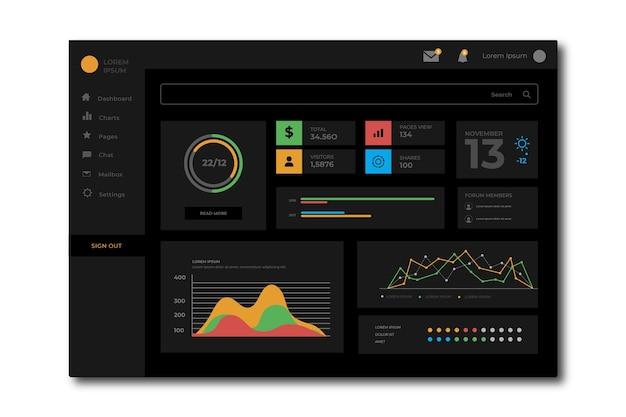
Data visualization is a method of presenting key information using visual graphics. You will often see a summary of this data in a “dashboard”. A digital dashboard for data visualization that includes charts and graphs can greatly simplify information delivery.
Digital signage displays are ideal for displaying these dashboard reports because of their high-resolution screens.
Let’s take an in-depth look at how data visualization digital signage facilitates dynamic communication across various sectors.
Benefits of Using Data Visualization Digital Signage
Using data visualization digital signage can really set a business up for success. Here are some key benefits of this type of digital signage content.
1. Dynamic Content Delivery
Data visualization is an art, and multi-touch digital signage screens offer dynamic content delivery. The dashboard graphics can easily capture a person’s attention and are visible from afar.
In fact, the human brain can process visual data better than any other kind of data.
This means that what we physically see can greatly influence our understanding more than other types of stimuli. When the content presented before us is dynamic and interactive, we are more likely to understand and retain it.
Your choice of colours also matters when it comes to data presentation. For instance, you might want to use contrasting colours to distinguish between elements of a report.
2. Communicate Effectively
Many businesses use digital signage for internal communication because it can be updated easily and stand out whether they’re placed indoors or outdoors.
Data dashboards can display the progress of certain projects. They can even enhance transparency by enabling live data feeds for employees’ use.

Digital displays make information easily accessible on business premises.
They can be used to display real-time data like conference room occupancy or punctuality metrics across departments.
Utilizing interactive data visualization streamlines the information delivery process.
When used as a visual aid in presentations, the digital signage dashboard conveys statistical metrics without a hitch.
3. Summarize Data
It’s pretty clear that data visualization digital signage summarizes data.
An intuitive enough digital signage system also integrates with other management tools and allows you to access data from different departments in one place.
This can speed up communication and decision-making.
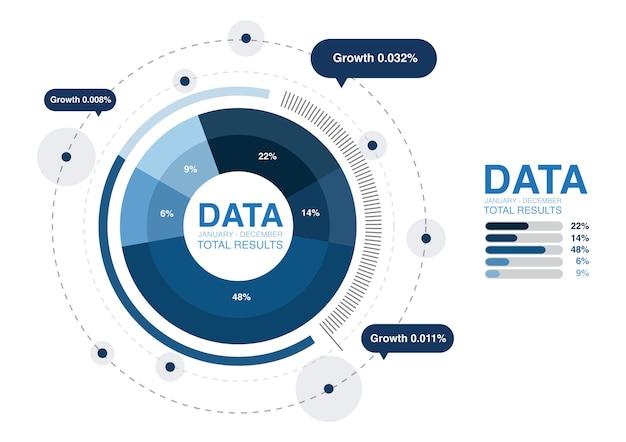
As companies grow, their trackable metrics grow, and a digital signage dashboard helps to condense large amounts of data into bite-sized pieces.
What would have initially been pages of text can be summarized into graphs, tables, or charts.
4. Show Credibility
Data visualization often gives the impression that prior research has been done.
This helps you gain credibility whether you are presenting the information to shareholders or customers.
In other words, a digital signage dashboard denotes expertise, which in turn, enhances brand trust
5. Inspire Motivation
Enterprises are investing much in social media campaigns but neglect their premises.
However, businesses can inspire and motivate their staff using data visualization content on digital signage.
Technology transforms how facilities operate and improves employees’ performance.
Displaying inspirational quotes and motivational content will positively impact staff towards performing their duties better.
For instance, display the company’s goals and current progress. This might kindle a competitive flame or boost team morale.
Other things that can be included in the digital signage dashboard that serve as motivation could be social media feeds, YouTube videos, and trending news about the brand.

6. Real-Time Updating
A truly noteworthy aspect of data visualization digital signage is that it can be updated in real-time.
Just like smart city digital signage, real-time updates are important for preserving the accuracy of information.
Employees might need the most current data to make decisions, and because there’s a minimal lag in data updating, digital signage is now a friend to many corporations.
Applications of Data Visualization Digital Signage
Data visualization digital signages streamlines communication within the work environment and simplify complex data for better decision-making.
They are versatile displays with numerous applications.
Here are some industries benefiting from the technology.
1. Corporate Buildings
Corporations use conference room digital signage to improve communication and keep the work environment engaging for their employees.
Data visualization digital signage has become standard in office buildings and boardrooms. By displaying summarized data, targets, mission, and values, companies tend to perform better than those without this technology.
Below are ways corporates leverage data visualization for success;
- Sharing performance reports.
- Cultivate competition by displaying team output against the company targets.
- Providing digital signage real-time updates on business data.

2. Industrial
Industries can simplify progress tracking and processes using data visualization. Manufacturing facilities can display key performance indicators on extensive digital displays in graphs and tables. Workers can visualize their production metrics using digital displays in real-time.
Besides giving insights into production processes, it assists industries in identifying errors along the way. Workers get a broader manufacturing process perspective through reports that cut across the entire product lifecycle.
Simply put, digital signage improves business even on the manufacturing scale.
Another application of data visualization digital signage is creating floor awareness in a factory. Industries enhance safety at their facilities through fast information sharing.

3. Academic
Learning institutions use digital signage solutions to improve learners’ performance. Data visualization digital signage can be used to display students’ class attendance and grades.
Students can gauge and understand their performance using the information on display.
Education center statistics are more manageable and easier to summarize so that insights can be drawn. Management can identify any gaps in learning to take steps toward achieving the institution’s goals.
4. Business and Finance
Data visualization assists businesses in achieving their financial goals. It is also useful for forecasting and strategizing. Converting raw data into tables, graphs, or charts makes it easy for the stakeholders to understand.
Businesses can provide real-time data about their company using elevator digital signage.
Financial institutions use the screens in the business environment to display stock prices and loan interest rates. The technology enables management to make data-driven decisions essential for customer satisfaction and success.
5. Community
Digital signage and data visualizations can be used in community events like fundraising or charity auctions.
Organizers can display the target and current progress based on funds received.
Showing the progress on a large dashboard in real-time creates a sense of shared enthusiasm and may encourage people to give more.
Featuring and sending a shout-out to donors on those same screens can show appreciation and encourage more donations.
REV Interactive as Your Trusted Service Provider
Choose a trusted service provider if you’re looking to start using data visualization with digital signage.
Rev Interactive is a well-established and experienced company for digital signage solutions with a global client base.

Choosing a reputable software and hardware provider is essential for guaranteeing ROI. You want to get durable components for longevity and access the best technology to gain a competitive edge over rivals.
We are a team of professionals who work closely with our clients to develop their ideas and make them a reality.
Final Word
At Rev Interactive, we work to customize your digital signage system depending on your industry. We offer next-generation technology for business digitization and sleek user-friendly hardware.
Rest assured that each part of the setup will be handled by trained technicians, and you will love the end result.
Contact Rev Interactive if you’d like to start using data visualization digital signage!